INTRODUCTION
In part one of this four-part blog series on modern data management, we discussed the activities and deliverables involved in refining data and creating a successful data management system and project plan. Part two leverages the progress made in the Strategy phase to guide the second phase of the process — Discover.
As the name implies, the Discovery phase is focused on several activities that will identify all current data-related elements and map the flow of data throughout its lifecycle. However, sifting through disparate data repositories and making sense of the processes (and personnel) involved in current data lifecycles can seem like trying to untangle a disorganized web of knots.
While these exercises may seem daunting, identifying what elements exist, as well as those that need to be developed, will pay dividends towards supporting the organization’s data vision and accompanying business goals. Now, let’s dive into the specific activities in the Discover phase.
As you work to establish the current state of data, you’ll discover what elements already exist and what elements need to be developed throughout your project timeline.
You’ll also begin to see the gaps between the current state of your data and the data vision statement you created in Phase one (Strategy). To begin this exercise, you’ll need to create a current state of architecture diagram. Follow the steps below to begin the process.
Steps to develop your current state of architecture diagram
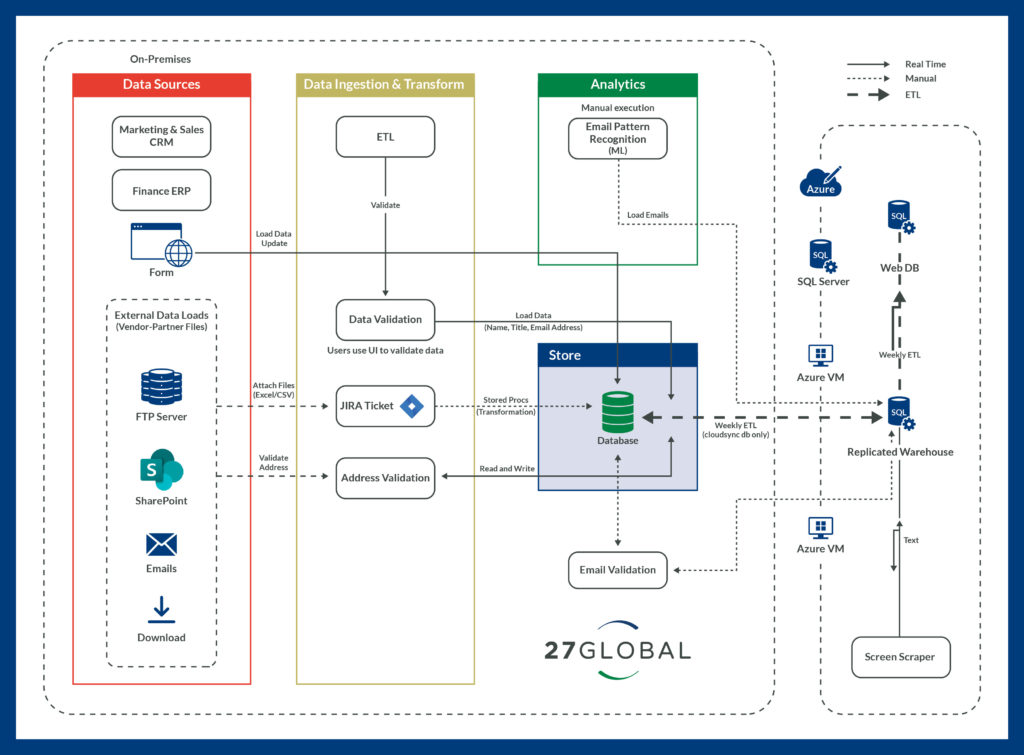
Below is an example client’s current state of architecture diagram. In this example, the client has numerous manual processes and ETL jobs preventing them from scaling and delivering data to their customers in a timely manner.
Identify Key Data Elements
Once the current data architecture has been mapped out, you’ll need to understand and identify different types of data and the data’s core elements. Doing so helps you analyze the various relationships and dependencies within your data. You should also be able to map data elements to business processes.
Data Types and Key Elements to identify:
Assess Data Quality
Once data types, elements and key relationships/dependencies have been identified, the next step is ensuring the data can be transformed into high quality assets. This is done by measuring the data quality.
There are six quantifiable elements of data quality:
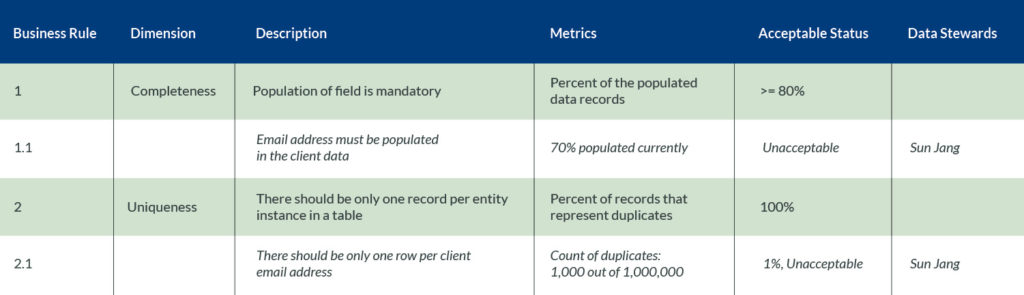
Data quality management and assessment solutions are available to automatically measure and score these elements based on user-defined “rules.” An example of metric results is below.
Design Target Data Architecture
You’ve gathered data and identified the gap to achieving your vision statement, so now you can begin to lay out the “future state” data models and architecture. At this point, it is imperative to revisit the business’ data-related goals and vision statement identified in the Strategy phase. This ensures the data models and architecture will support the desired business goals..
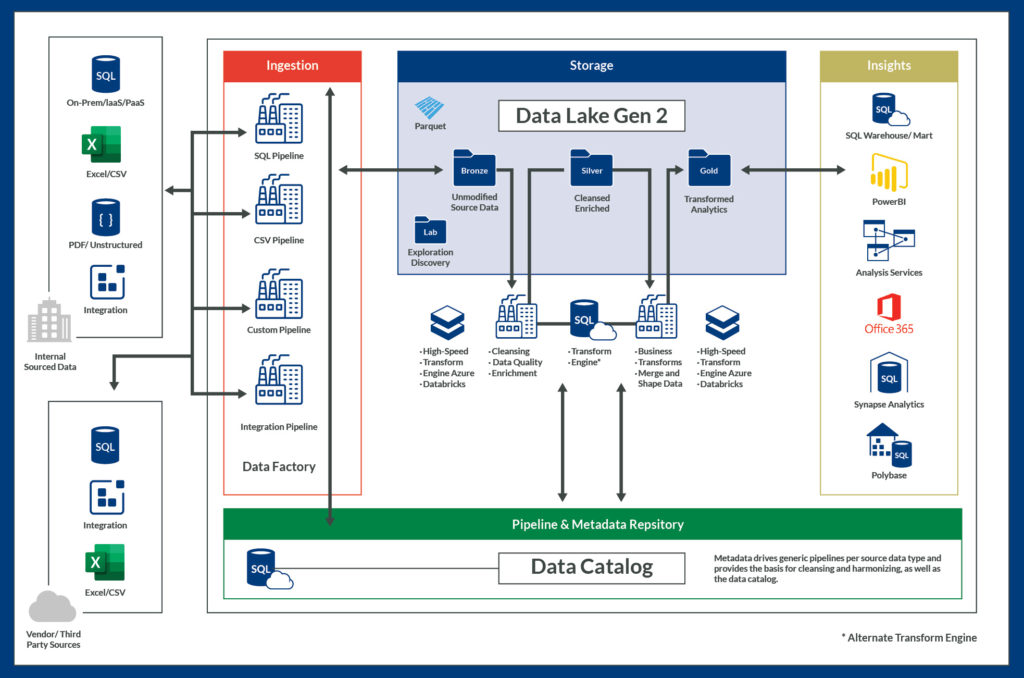
Continuing with the previous client example, below is a target, cloud-based data architecture. Here, the data sources are integrated with cloud-based serverless services and automated workflows. The combination of those two aspects meet the client’s goals and data vision, which were to have the ability to scale in a cost-effective manner and to automate processes.
Design Target Cloud Architecture
Next, you’ll need to design a target cloud architecture in consideration of the data architecture and data privacy policies. It’s important to document the required resources, data security elements and the CI-CD process.
Tools
Data change management tools can provide features such as
Popular tools include: Alation, Ataccama, Informatica, Talend, etc.
Project Roadmap and Cost Estimates
Based on the target data and cloud architectures, create the project roadmap with cost estimates and a project timeline.
From the activities above, the Discover phase should provide the following deliverables:
Now that the Strategy and Discover phases are complete, you can see how the data journey and process builds upon itself- the business goals and supporting data vision identified during the Strategy phase provided guidance for Discover phase, which establishes a blueprint for the third step in the process, Implement.
Read the third installment of our data management strategy blog series on the Implement process here for insight into the activities and deliverables, as well as unique considerations and recommendations of the Implement phase of your data journey.
Contact us today
Contact us todaySun Jang is a Principal Architect at 27Global. Founded in 2008, 27Global designs, builds, and operates technology solutions for businesses of all sizes. The perfect pairing of a local leadership with offshore pricing, 27Global has the business acumen to understand your vision and the expertise to build your technology solution. To learn more, visit 27global.com or connect with us on LinkedIn and Twitter.